This is just a quick note on how to leverage a couple reports in order to identify if a PX has been downgraded. Those reports have been around for quite some time so this isn’t about any new feature but rather how to use what’s already there 😉
An execution is downgraded when the number of PX slaves used by the SQL at runtime is lower than the requested number, there are few reasons why it can happen with the most common one being the lack of available PX slaves at the time the SQL starts. Such a downgrade can cause from small to catastrophic performance degradation depending on the severity of the downgrades (measured in %) since the CBO generates an execution plan expecting to have some specific horsepower (aka number of PX slaves) at disposal but then such horsepower is reduced. It’s like planning how long it will take to drive from A to B with a Ferrari and then go to the garage and find out you only have a Jetta 😀
SQLd360 aims at making it easier (and quicker) to identify if an execution was downgraded, let’s see how.
The requested DoP for a SQL is stored in the OTHER_XML column, for each PHV/source SQLd360 provides in the “SQL Performance Summary” the MIN and MAX DoP requested, which is likely to stay stable overtime (exception made for Adaptive Degree Policy or Adaptive Multi User, which aren’t that common anyway).
Here is an example of a SQL with a requested DoP of 4:

Starting from 11gR2 the DoP the SQL executed with can be extracted from column PX_FLAGS in ASH (TRUNC(px_flags / 2097152) as already reported by Randolf here) so for each execution that made it into ASH SQLd360 reports the “execution DoP”.
Here is the output from report “Elapsed Time for Recent Execs”:
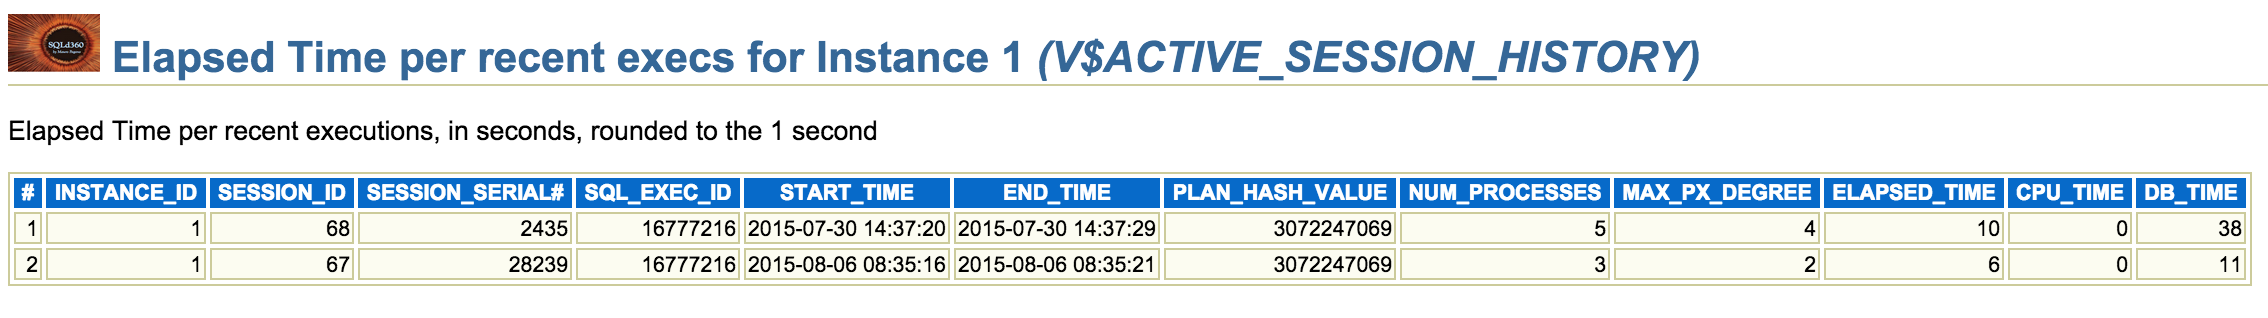
Column MAX_PX_DEGREE is the MAX(DoP) this specific execution used (see note below about why MAX).
Column NUM_PROCESSES is the distinct number of ASH sampled sessions that collaborated to this execution (up to 2*DoP).
From the report above it’s easy to spot how the execution from July 30 was indeed executed at the requested DoP (4) while the one from August 6 was downgraded (requested DoP 4, execution DoP 2).
Note: ASH reports the DoP by DFO tree so if the plan had multiple DFO trees with different DoP (uncommon but possible) just keep in mind the number you see in the report is the MAX.
