Mauro Pagano's Blog


4 Comments

SQLTXPLAIN vs SQLd360, differences and similarities

When talking tools to help with SQL Tuning the question on SQLTXPLAIN vs SQLd360 comes out very often. “What’s the difference?”, “Which one should I use?”, “Why another tool?” are probably the top ones 🙂

I’ll try to make a fair and (as much as possible) unbiased comparison between the two on some general aspects. If you want to know of any specific area just let me know in the comments.

Aspect SQLTXPLAIN SQLd360
Installation Requires installation. Creates two schemas that serve as metadata and code repository, they need to be present every time the tool is executed No installation, at the end of the execution no evidence is left behind
Source code Mainly PL/SQL, unwrapped (clear text). Code is Oracle property SQL scripts, clear text, true open source released under GPL. Code available on GitHub
Main Goal Automate every aspect of diagnostic collection for SQL tuning Same as SQLT, but less “obsessive” 🙂
Main Focus Execution plan generation, why CBO generated plan X,Y,Z (includes custom testcase, very flexible) Execution plan generation (but a little less than SQLT) and how plans execute at runtime
Main advantage Includes every bit of info needed to drill into CBO decisions, unlikely the need to go back and collect anything else Makes diagnostic consumption faster and easier because of data visualization, lots of focus on runtime
Main disadvantage Requires installation. Not much focus on execution time (“same plan different performance” type of cases harder to deal with) Might miss some information under rare circumstances

Outside the comparison table, what we use today: SQLd360
Reason(s):

  1. No installation.
  2. Root Cause Analysis of CBO decisions usually belongs to Oracle Support (for the most part), SQL Tuning in the real world focuses on easier aspects of plan generation, thus lower need for strong focus on it.
  3. Performance data available in Oracle grows by release, charting allows quick and way more effective consumption of large amount of such data.


Leave a comment

Little help in creating SQL Plan Baselines

One of the main design goals behind SQLd360 is to have no installation nor “evidence” left in the database, i.e. there is no SQLd360 repository in the database while there is a SQLTXPLAIN one (this isn’t necessarily bad, it’s just a different approach).

As a consequence several little things SQLT provided are gone with SQLd360, for example few years ago (it’s been disabled by default for a while) SQLT generated a script to create a “custom” SQL Profile for the best performing plan it identified, something similar was happening for SQL Plan Baselines stored in SQL Tuning Set for quick implementation of baselines down the road.

There is a new standalone script shipped with SQLd360, sql/sqld360_create_sql_baseline.sql, that aims at providing the same functionality of SPM+STS provided by SQLT, using the idea of “no evidence left by default”.
The script is NOT executed as part of SQLd360, it can (and needs to) be manually executed at any time, which in turns means there is no need to run SQLd360 for this script to work.
The script requires three parameters:

  • SQL ID for the SQL of interest
  • Oracle Pack available in this database ([N]one, [D]iagnostic or [T]uning)
  • Plan Hash Value you wish to “freeze”

You can provide the parameters directly inline to SQL*Plus (assuming you know the PHV you want to enforce) or just enter them one by one when prompted, the script will list all the PHV it can find around (memory + history) with their performance, helping you in case you don’t recall which PHV you want.

The script does just two things:

  1. It create a SQL Tuning Set (named s_<<SQLID>>_<<PHV>>) and loads the plan details into it, the goal is to “freeze” it in time so info don’t get lost if the plan is aged out of memory, purged from AWR, etc.
  2. Provide copy&paste instructions to create a Baseline based on the plan in the STS either in the current system or in a remote one. The script DOES NOT execute such steps, only prints them at screen. This way you can read, understand, digest and validate them before YOU execute them.

Hopefully it will make it a little bit easier to play with SPM.

Feedbacks, correction, recommendations are welcome as usual!


Leave a comment

Top Executions SQL Monitoring style reports in SQLd360

I think SQL Monitoring is an amazing tool when it comes to SQL Tuning but I often find that for one reason or another the report is almost never around for post-mortem investigation.
Historical SQL Monitoring reports have been introduced in 12c but still the decision to collect or no the report for the SQL ID we are interested in depends on several factors we have no control on after the issue happened 😦

SQLd360 tried to alleviate this “issue” including ASH-based charts that provided similar information, those have been available for a long time in the Plan Details page, organized by Plan Hash Value (PHV).
The main difference between SQL Monitoring (SM) and SQLd360 is the scope. SM provides info for a single execution while SQLd360 aggregated info from all the executions active at a specific point in time. Info for recent executions are (V$ACTIVE_SESSION_HISTORY) are aggregated by minute while historical executions (DBA_HIST_ACTIVE_SESS_HISTORY) get aggregated by hour.
That section of the SQLd360 looks like this:

Screen Shot 2016-01-14 at 9.46.54 AM.png


Starting SQLd360 v1601 a new set of reports is provided for the Top-N executions per PHV, where a “top execution” is one of those with the highest number of samples.
The goal is to replicate, as close as possible, the SQL Monitoring functionalities using just the ASH data, which tend to be around for much longer than a SQL Monitoring report 🙂

The data is not aggregated so the granularity is 1s for samples from memory (V$) and 10s for samples from ASH (DBA_HIST).
With this level of granularity combined with the non aggregation other types of data visualizations make sense, like i.e. timelines to identify when a specific section of the execution plan was active (the which section is the “bad guy” can be answered from the tree chart), that’s the “Plan Step IDs timeline” in the figure below that will need its own blog post 😀 .
This new section of the report looks like this:

Screen Shot 2016-01-14 at 9.58.46 AM.png

So i.e. for each execution we can see the active sessions (plural in case of PX and not “Average Active Session” since there is no timeframe aggregation) with associated CPU/wait events over time, just like in SQL Monitoring (to be fair SQL Monitoring is able to provide sub-second details, which are not available in ASH).

Screen Shot 2016-01-14 at 10.04.50 AM.png

Hopefully you’ll find this new section useful, specially when ASH is all you got 😀

Final note: the number Top-N executions is configurable in file sql/sqld360_00_config.sql altering the value for sqld360_conf_num_top_execs (default is 3).

As usual feedback, comments, suggestions are all more than welcome!


1 Comment

Histograms come histograms go

Actually the title is likely incorrect, in the sense that I think histograms don’t “go” once they come. Or at least I’ve never seen a case where consistently gathering statistics using method_opt “SIZE AUTO” makes a histogram go away sometime after the same syntax made it show up (while it’s common for a histogram to just show up sometime in the future because of column usage).

Recently I’ve seen several systems where custom statistics gathering procedures were coupled with the automatic stats gathering job (voluntarily or not is another story… 😀 ) triggering all sort of weirdness in the statistics. Reason was a syntax mismatch between the custom job (method_opt “SIZE 1”) and the automatic job (default is method_opt “SIZE AUTO”).

A reliable way to figure out if histograms popped up / disappeared is to look at WRI$_OPTSTAT_HISTGRM_HISTORY, too bad this table is usually large and expensive to access (and not partitioned).
Another table is available though, table WRI$_OPTSTAT_HISTHEAD_HISTORY, which is the historical version of the dictionary table HIST_HEAD$ (1 row per histogram) but while in the dictionary there are BUCKET_CNT and ROW_CNT columns (so it’s easy to spot a histogram) such columna are gone once the info are stored in WRI$. Wouldn’t it be nicer to just have a column in WRI$_OPTSTAT_HISTHEAD_HISTORY saying “histogram was in place” ?

Let’s see if we can figure out a (approximate) way that can save us a trip to WRI$_OPTSTAT_HISTGRM_HISTORY.

Table WRI$_OPTSTAT_HISTHEAD_HISTORY has a column FLAGS that is populated using the following expression in 11.2.0.4 (extracted from a 10046 trace of DBMS_STATS.GATHER_TABLE_STATS)


bitand(h.spare2,7) + 8 + decode(h.cache_cnt,0,0,64)

while it’s tricky and risky to guess what SPARE2 might store it should be pretty easy to play with CACHE_CNT, we just need to gather stats with and without histograms to see how the value changes.

SQL> create table test_flag (n1 number);
SQL> insert into test_flag select mod(rownum,200) n1 from dual connect by rownum <= 10000; SQL> insert into test_flag select * from test_flag;
--repeat it a few times to make the data grow
SQL> commit;
SQL> exec dbms_stats.gather_table_stats('MPAGANO','TEST_FLAG',method_opt=>'FOR ALL COLUMNS SIZE 254');
SQL> select obj#, col#, bucket_cnt, row_cnt, cache_cnt, null_cnt, sample_size from sys.hist_head$ where obj# in (select object_id from dba_objects where object_name = 'TEST_FLAG');

      OBJ#       COL# BUCKET_CNT    ROW_CNT  CACHE_CNT   NULL_CNT SAMPLE_SIZE
---------- ---------- ---------- ---------- ---------- ---------- -----------
     24897          1       5487        200         10          0        5487

SQL> exec dbms_stats.gather_table_stats('MPAGANO','TEST_FLAG',method_opt=>'FOR ALL COLUMNS SIZE 1');
SQL> select obj#, col#, bucket_cnt, row_cnt, cache_cnt, null_cnt, sample_size from sys.hist_head$ where obj# in (select object_id from dba_objects where object_name = 'TEST_FLAG');

      OBJ#       COL# BUCKET_CNT    ROW_CNT  CACHE_CNT   NULL_CNT SAMPLE_SIZE
---------- ---------- ---------- ---------- ---------- ---------- -----------
     24897          1          1          0          0          0     2560000

In the first run we gathered stats with “SIZE AUTO” and a 200 buckets histogram was created, sample size ~=5500 is not surprising and it matches with AUTO_SAMPLE_SIZE used. In this case CACHE_CNT was 10.

In the second run we gathered stats with “SIZE 1” and no histogram was created. In this case CACHE_CNT was 0.

I couldn’t find with 100% accuracy what CACHE_CNT represents (actually if any reader knows it please comment this post) but my educated guess is that’s number of entries to be cached in the row cache; unfortunately this is really just a guess since I didn’t even find a parameter to change this value (again, whoever knows better please let me know).

I ran multiple tests and it seems like CACHE_CNT has a value larger than 0 only when a histogram is present (assuming my guess of what is means is accurate), thus the value of WRI$_OPTSTAT_HISTHEAD_HISTORY.FLAG is bumped by 64 only when a histogram is present.
With this info in mind it’s now pretty easy to spot if a histogram was present in the past just looking at  WRI$_OPTSTAT_HISTHEAD_HISTORY.FLAG without having to access the larger WRI$_OPTSTAT_HISTGRM_HISTORY.

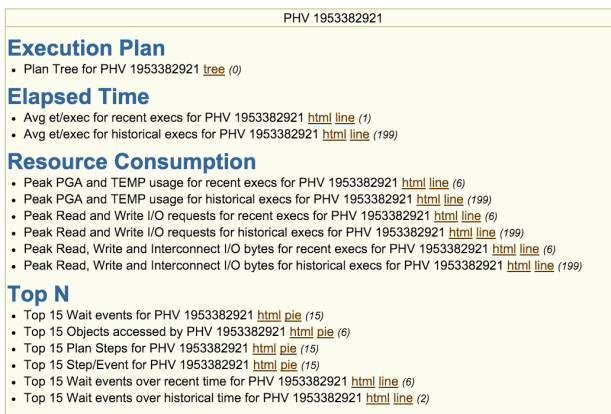
SQLd360 v1526 has a new column HAD_HISTOGRAM added to the Column Statistics Version report built exactly on the assumptions made here.

Feedbacks welcome as usual, especially if they can prove wrong what I just said 😀


12 Comments

Introducing Pathfinder, is there a better plan for my SQL?

Pathfinder is a new free tool that provides an easy way to execute a SQL statement under multiple optimizer environments in order to generate different execution plans, potentially discovering better plans. The tool can also be used to quickly identify workarounds for wrong result bugs as well as slow parse issues.

Pathfinder uses the same brute-force approach of SQLT XPLORE, executing the SQL for every single CBO parameter and fix_control present in the database, with no installation required. This make Pathfinder easy to run in any environment, including a production one (assuming you understand *WELL* what the tool does, how it works and what it means for your database).

Each test adds approximately 1 second overhead to the time the SQL takes to complete and the amount of tests considered is pretty high, in 11.2.0.4 it’s around 1100 and around 1500 in 12.1.0.2, thus I suggest to use Pathfinder on SQLs that take at most a few seconds to run (or just be ready to leave Pathfinder run for a loooong time).

The tool executes the SQL statement present in file script.sql (provided), just modify the script and replace the seeded SQL with the one you want to execute. In the same script you can also add ALTER SESSION commands that will be executed before the desired SQL, this is helpful in case you want to influence the analysis providing a different starting point.

To execute the tool just download it from the Download section on the right side of this page (or from here, also the tool will be released as standalone script in the same zip file as SQLd360) and follow these steps:

  1. Unzip pathfinder-master.zip, navigate to the root pathfinder directory, and connect as SYS to the database.
    $ unzip pathfinder-master.zip
    $ cd pathfinder-master
    $ sqlplus / as sysdba
  2. Open file script.sql and add your SQL in there. Make sure to add the mandatory comment /* ^^pathfinder_testid */. The file name must be script.sql, if you wish to change the name then just ping me.
  3. Execute pathfinder.sql and provide the connect string to connect as the user that is supposed to run the script.
  4. Unzip output file pathfinder_<dbname>_<date>.zip into a directory on your PC and review the results starting from file 00001_pathfinder_<dbname>_<date>_index.html

SQL> @pathfinder

Parameter 1:
Full connect string of the database to run the SQL into
If the database is remote or a PDB then you must include
the TNS alias i.e. scott/tiger@orcl

Enter value for 1: mpagano/mpagano@orcl
mpagano/mpagano@orcl
Building Pathfinder driver scripts
Connected.

1) "pathfinder_{ 20151026_1906 (00001)" 19:06:40 BASELINE

2) "pathfinder_{ 20151026_1906 (00002)" 19:06:42 "_add_stale_mv_to_dependency_list" = FALSE

.....
File pathfinder_orcl_20151023_1256.zip created.

For each test Pathfinder will show the setting considered as well as some basic statistics like Plan Hash Value, Elapsed Time, CPU Time, Buffer Gets and Rows processed. Also two links are present, one points to the details of the execution plan generated while the other points to the details of V$SQL.

The main page will look something like this:

Screen Shot 2015-10-26 at 9.18.44 PM

Pathfinder also considers the effect of Cardinality Feedback executing the SQL multiple times until the plan stops changing (or CFB gives up after the fifth parse), for all those settings that lead to a first execution plan different than the baseline.
This is why for some settings you will see a Test# with an additional digit, the “reparse” number:

Screen Shot 2015-10-26 at 9.22.23 PM

In example for Test# 117 above the CBO generated a different plan (PHV 1837274416) than the baseline (PHV 1838229974) and Cardinality Feedback kicked in 3 times generating a different plan each time, until the 3rd parse when the CBO ended up with the same plan as the first execution (and no different plan was generated after).

This is the first release of the tool so I expect it to be far from perfect but I’ve already used it several times with success. Hopefully with time (and your feedbacks :D) the tool will get better and better.

I hope you enjoy it and please don’t hesitate to get in touch with me for feedbacks, suggestions and bugs!!!


Leave a comment

Little big change in SQLd360

Just a super-quick note on SQLd360, starting with version v1522 (released a couple days ago), CSV and TEXT formats are disabled by default so a report that looked like this before
Screen Shot 2015-08-20 at 8.36.47 AM
will now look like this
Screen Shot 2015-08-20 at 8.37.22 AM
Nothing to be alarmed of, it’s expected!
In case you want the two formats back you can just edit file sql/sqld360_00_config.sql.

The main advantage of this change should be a significant reduction in the time it takes to collect the report (feedbacks welcome as usual) 😀
Also the number of rows per report is computed differently, which should save some extra time!

PS: the same change is in eDB360 v1526


Leave a comment

How to quickly identify if a SQL running in parallel has been downgraded using SQLd360

This is just a quick note on how to leverage a couple reports in order to identify if a PX has been downgraded. Those reports have been around for quite some time so this isn’t about any new feature but rather how to use what’s already there 😉

An execution is downgraded when the number of PX slaves used by the SQL at runtime is lower than the requested number, there are few reasons why it can happen with the most common one being the lack of available PX slaves at the time the SQL starts. Such a downgrade can cause from small to catastrophic performance degradation depending on the severity of the downgrades (measured in %) since the CBO generates an execution plan expecting to have some specific horsepower (aka number of PX slaves) at disposal but then such horsepower is reduced. It’s like planning how long it will take to drive from A to B with a Ferrari and then go to the garage and find out you only have a Jetta 😀

SQLd360 aims at making it easier (and quicker) to identify if an execution was downgraded, let’s see how.

The requested DoP for a SQL is stored in the OTHER_XML column, for each PHV/source SQLd360 provides in the “SQL Performance Summary” the MIN and MAX DoP requested, which is likely to stay stable overtime (exception made for Adaptive Degree Policy or Adaptive Multi User, which aren’t that common anyway).
Here is an example of a SQL with a requested DoP of 4:

Screen Shot 2015-08-06 at 8.58.09 AM

Starting from 11gR2 the DoP the SQL executed with can be extracted from column PX_FLAGS in ASH (TRUNC(px_flags / 2097152) as already reported by Randolf here) so for each execution that made it into ASH SQLd360 reports the “execution DoP”.
Here is the output from report “Elapsed Time for Recent Execs”:

Screen Shot 2015-08-06 at 9.18.43 AM

Column MAX_PX_DEGREE is the MAX(DoP) this specific execution used (see note below about why MAX).
Column NUM_PROCESSES is the distinct number of ASH sampled sessions that collaborated to this execution (up to 2*DoP).

From the report above it’s easy to spot how the execution from July 30 was indeed executed at the requested DoP (4) while the one from August 6 was downgraded (requested DoP 4, execution DoP 2).

Note:  ASH reports the DoP by DFO tree so if the plan had multiple DFO trees with different DoP (uncommon but possible) just keep in mind the number you see in the report is the MAX.


2 Comments

Poor man SQL Monitor with SQLd360…kind of!

One of the most interesting section of a SQL Monitor report is IMHO the Metrics page where we can see on a timeline the impact / requirement on an execution in terms of CPU, IOPS, MBPS, PGA and TEMP.
Starting 11gR2, we can get something similar (not exactly the same) from ASH, this is from DBA_HIST_ACTIVE_SESS_HISTORY

Screen Shot 2015-04-27 at 9.37.15 AM

For each TM_DELTA_TIME we know how much CPU and DB Time has been spent, as well as how many RW IOPS and RW and Interconnect (M)BPS per DELTA_TIME. The metrics are accumulated and reported at the time of the ASH sample “over the Delta Time” that roughly matches with the ASH sampling one, so ie. from V$ACTIVE_SESSION_HISTORY we are able to see how many RW IOPS per second (since the DELTA_TIME is roughly going to be the second) are accounted by the session we focus on. Also each time the ASH sample is taken the PGA and TEMP consumed by the session at that time is tracked.

Starting SQLd360 v1511 those columns are now collected and aggregated/charted over time so we can look at the single consumption via SQL Monitor (or from raw ASH data) and at the same time evaluate the historical trend from SQLd360. The PlansAnalysis page in SQLd360 now looks something like this

Screen Shot 2015-04-27 at 10.54.29 AM

Other new additions since the last post (v1507) are:

  • SQLd360 now uses a configuration file to determine how many days to collect info for and which “major” external APIs to collect / ignore
  • Several reports have been rewritten to better represent info from Parallel Executions
  • New sections provide info on
    • Fix Controls (default and non-default) settings
    • NLS settings
    • Adaptive Cursor Sharing info
    • SQL Monitoring info
    • Partition Statistics history info
    • SQLs with the same Force Matching Signature

plus as usual bug fixes here and there.

Thanks to everybody who reported issues and provided feedback for new features! 🙂


Leave a comment

Quick update on SQLd360 recent changes

The last blog post was about SQLd360 v1504 and last night I released v1507 so a couple released (v1505, v1506) were silent. This post is just a quick update of what’s changed in the last weeks.

  • ASH SQL reports have been removed, the API is very slow (was taking up to 90% of the overall SQLd360 elapsed time) and the report itself is usually not that useful compared to raw data.
  • ASH Raw Data report has been enhanced with several new columns (mostly wait events related), this section is useful for quick searches on the most common ASH columns
  • SQLd360 now leverages eAdam to export GV$ACTIVE_SESSION_HISTORY and DBA_HIST_ACTIVE_SESS_HISTORY for the SQL ID of interest, this is useful for detailed ASH mining operations
  • Two new reports have been included, number of execs by PHV and total elapsed time by PHV, they can help in understanding how impact each PHV is (ie. one single exec of the bad plan took as much as 20 execs for the good plan)
  • CBO environment and IO Calibration statistics are now collected

Plus a few minor improvements as well as several bug fixes 🙂

As usual please reach out of me if you have any question/comment/concern/suggestion!!