I think SQL Monitoring is an amazing tool when it comes to SQL Tuning but I often find that for one reason or another the report is almost never around for post-mortem investigation.
Historical SQL Monitoring reports have been introduced in 12c but still the decision to collect or no the report for the SQL ID we are interested in depends on several factors we have no control on after the issue happened 😦
SQLd360 tried to alleviate this “issue” including ASH-based charts that provided similar information, those have been available for a long time in the Plan Details page, organized by Plan Hash Value (PHV).
The main difference between SQL Monitoring (SM) and SQLd360 is the scope. SM provides info for a single execution while SQLd360 aggregated info from all the executions active at a specific point in time. Info for recent executions are (V$ACTIVE_SESSION_HISTORY) are aggregated by minute while historical executions (DBA_HIST_ACTIVE_SESS_HISTORY) get aggregated by hour.
That section of the SQLd360 looks like this:
Starting SQLd360 v1601 a new set of reports is provided for the Top-N executions per PHV, where a “top execution” is one of those with the highest number of samples.
The goal is to replicate, as close as possible, the SQL Monitoring functionalities using just the ASH data, which tend to be around for much longer than a SQL Monitoring report 🙂
The data is not aggregated so the granularity is 1s for samples from memory (V$) and 10s for samples from ASH (DBA_HIST).
With this level of granularity combined with the non aggregation other types of data visualizations make sense, like i.e. timelines to identify when a specific section of the execution plan was active (the which section is the “bad guy” can be answered from the tree chart), that’s the “Plan Step IDs timeline” in the figure below that will need its own blog post 😀 .
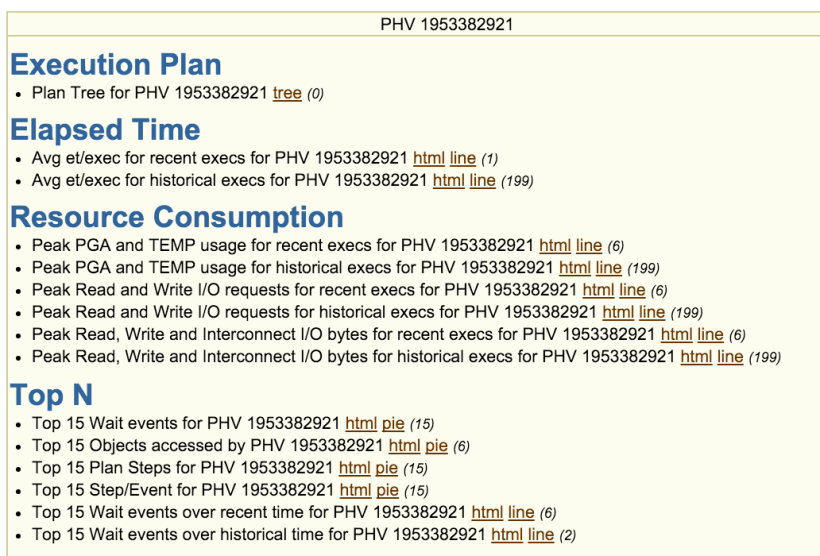
This new section of the report looks like this:

So i.e. for each execution we can see the active sessions (plural in case of PX and not “Average Active Session” since there is no timeframe aggregation) with associated CPU/wait events over time, just like in SQL Monitoring (to be fair SQL Monitoring is able to provide sub-second details, which are not available in ASH).

Hopefully you’ll find this new section useful, specially when ASH is all you got 😀
Final note: the number Top-N executions is configurable in file sql/sqld360_00_config.sql altering the value for sqld360_conf_num_top_execs (default is 3).
As usual feedback, comments, suggestions are all more than welcome!
