Mauro Pagano's Blog


2 Comments

Introducing SQLdb360: merging eDB360 and SQLd360, while raising the bar for community engagement

Today, we are very happy to release SQLdb360, a new tool that merges together eDB360 and SQLd360, under a single package

Tools eDB360 and SQLd360 can still be used independently, but now there is only one package to download and keep updated. All the new features and updates to both tools are now in that one package.

The biggest change that comes with SQLdb360 is the kind invitation to everyone interested to contribute to its development. This is why the new blended name and its release format.

We do encourage your help and ideas to continue building a free, open-source, and hopefully a YMMV great tool!

Over the years, a few community members requested new features, but they were ultimately slowed down by our speed of reaction to their requests. Well, no more!

Few consumers of these tools implemented cool changes they needed, sometimes sending us the changes (or pull requests) until a later time. This means good ideas were available to others after some time. Not anymore!

If there is something you’d like to have as part of SQLdb360 (aka SQLd360 and eDB360), just write and test the additional code, then send us the pull request! Next, we will review, validate, and merge your code changes to the main tool.

There are several advantages to this new approach:

  1. Carlos and Mauro won’t dictate the direction of the tool anymore: we will continue helping and contributing, but we won’t “own” it anymore (the community will!)
  2. Carlos and Mauro won’t slow down the development anymore: nobody is the bottleneck now!
  3. Carlos and Mauro wan’t run out of ideas anymore!!! The community has great ideas to share!!!

Due to the nature of this new collaborative effort, the way we now publish SQLdb360 is this:

  • Instead of linking to the current master repository, the tool now implements “releases”. This, in order to snapshot stable versions that bundle several changes together (better than creating separate versions per merge into master).
  • Links in our blogs are now getting updated, with references to the latest (and current) stable release of SQLdb360 (starting with v18.1).

Note: Version names sound awfully familiar to Oracle nomenclature, right? Well, we started using this numbering back in 2014!!!

Carlos & Mauro


5 Comments

Something new about SQL Plan Directives and 12.2

SQL Plan Directives (SPD) remind me of bind peeking about 10 years ago, a nice feature on paper that worked fine most of the times but caused some major headache on those occasions when it didn’t. Luckily for bind peeking social media wasn’t that popular 10y ago so it took a while to “make a name” for a troublemaking feature, nowadays a couple of blog posts and many re-tweets to get pretty popular, poor SPD!
DISCLAIMER: I happen to like a lot both features and think positively of them, I just admit the “transparent” behavior was a little too ambitious 😦

Just like for bind peeking (Adaptive Cursor Sharing), Oracle introduced some changes in 12.2 to mitigate the effect of SQL Plan Directives and Adaptive Dynamic Sampling (DS). Parameter OPTIMIZER_ADAPTIVE_FEATURES has been split in two, basically turning SPD off via parameter OPTIMIZER_ADAPTIVE_STATISTICS,  as Franck Pachot already explained here.

The goal of this post is look into what happens when we manually turn on OPTIMIZER_ADAPTIVE_STATISTICS. Focus will be on SQL Plan Directives alone instead of throwing DBMS_STATS in the mix too (especially since fix for bug 21171382 disables automatic column group creation based on info from SPD).

Let’s create a table with strong correlation across columns and see how 12.2 SPD behaves differently than 12.1

drop table tab1 purge;
create table tab1 (n1 number, n2 number, n3 number);
insert into tab1 select mod(rownum, 100), mod(rownum, 100), mod(rownum, 100) from dual connect by rownum <= 100000;
commit;
exec dbms_stats.gather_table_stats(user,'TAB1');

Table TAB1 has 100k rows with three numeric columns, all storing the same exact value and I’ll use the following SQL referencing all the three columns to lead the CBO into a trap (caused by lack of column group on the three columns).

select count(*) from tab1 where n1 = 1 and n2 = 1 and n3 = 1;

Let’s run the SQL a couple times flushing SPD and shared_pool after each execution just so that each change is persisted immediately and we can see the impact.

Run the SQL the first time and from DBA_SQL_PLAN_DIRECTIVES we have:

TYPE                    STATE      REASON                               NOTES 
----------------------- ---------- ------------------------------------ -------------------------------------------------------
DYNAMIC_SAMPLING        USABLE     SINGLE TABLE CARDINALITY MISESTIMATE <spd_note> 
                                                                         <internal_state>NEW</internal_state> 
                                                                         <redundant>NO</redundant> 
                                                                         <spd_text>{EC(MPAGANO.TAB1)[N1, N2, N3]}</spd_text> 
                                                                        </spd_note>

Same result from both 12.1 and 12.2, nothing too outstanding happens behind the curtains either beside the recursive SQLs related to SPD now have a nice “/* QOSD */” comment in there so they are easier to spot.

Run the SQL again, the CBO recognizes it doesn’t have sufficient info to make a good decisions thus ADS is triggered and SPD <internal_state> is updated to MISSING_STATS, pretty much same behavior in both 12.1 and 12.2 except in 12.2 there is no RESULT_CACHE hint in the DS SQL.
This is where things get interesting, in 12.2 there is one additional directive created to store the result of DS:

TYPE                    STATE      REASON                               NOTES
----------------------- ---------- ------------------------------------ ----------------------------------------------------------------------------------------------------
DYNAMIC_SAMPLING_RESULT USABLE     VERIFY CARDINALITY ESTIMATE          <spd_note>
                                                                         <internal_state>NEW</internal_state>
                                                                         <redundant>NO</redundant>
                                                                         <spd_text>{(MPAGANO.TAB1, num_rows=100000) - (SQL_ID:7pjdz422db2xk, T.CARD=1000[-2 -2])}</spd_text>
                                                                        </spd_note>

which allows the result not to be flushed out and survive a restart of the database, thus reducing the amount of DS SQL executed.

The spd_text provides info about the original number of rows (100k) and the number of rows returned by DS (1k), and it includes a SQL ID (7pjdz422db2xk) that sounds like the DS one, even though it’s just a slight variation of it, let’s look into it.
The recursive DS SQL executed is 0nkvqpzha4x88

PARSING IN CURSOR #140370085840592 len=301 dep=1 uid=106 oct=3 lid=106 tim=588259148047 hv=3768743176 ad='73b99738' sqlid='0nkvqpzha4x88'
SELECT /* DS_SVC */ /*+ dynamic_sampling(0) no_sql_tune no_monitoring optimizer_features_enable(default) no_parallel */ NVL(SUM(C1),0) FROM (SELECT /*+ qb_name("innerQuery") NO_INDEX_FFS( "TAB1") */ 1 AS C1 FROM "TAB1" "TAB1" WHERE ("TAB1"."N1"=1) AND ("TAB1"."N2"=1) AND ("TAB1"."N3"=1)) innerQuery

but the fix for 22760704  says “Generate ADS stmt cache key without hints to make it determinist”, which makes it safe to guess the SQL ID stored is a stripped down version of the original SQL text, with the goal of increasing the chance of matching it back when retrieving info from the SPD DS result.

It seems the CBO tries to find DS result using the SQL text of the DS SQL that it would like to execute (SQL ID 0nkvqpzha4x88)

SPD: qosdGetFObjKeyFromStmt: sqlText = SELECT /* DS_SVC */ /*+ dynamic_sampling(0) no_sql_tune no_monitoring optimizer_features_enable(default) no_parallel  */ NVL(SUM(C1),0) FROM (SELECT /*+ qb_name("innerQuery") NO_INDEX_FFS( "TAB1")  */ 1 AS C1 FROM "TAB1" "TAB1" WHERE ("TAB1"."N1"=1) AND ("TAB1"."N2"=1) AND ("TAB1"."N3"=1)) innerQuery (objid = 8846687189427653554)
>> Single Tab Card adjusted from 0.100000 to 1000.000000 due to adaptive dynamic sampling

but internally it modifies the SQL to search for such stripped down version without the hints in the external query block, this is visible via trace[ADS]

kkoadsComputeSqlid: sql_id=8846687189427653554: newText=SELECT /* DS_SVC */  NVL(SUM(C1),0) FROM (SELECT /*+ qb_name("innerQuery") NO_INDEX_FFS( "TAB1")  */ 1 AS C1 FROM "TAB1" "TAB1" WHERE ("TAB1"."N1"=1) AND ("TAB1"."N2"=1) AND ("TAB1"."N3"=1)) innerQuery, startPos = 20, stopPos = 120, newTextLen = 203, sqlLen = 302

and this is the SQL_ID 7pjdz422db2xk stored in the SPD.

It’s too early to know if these changes will address the existing concerns, especially since many sites will run with this feature disabled (by default) but I really like the way the “new” SPD seems to work!!

In summary the most notable changes in 12.2 seems to be:

  • SPD still triggeres ADS but the result is stored inside SPD itself and persisted
  • Search in the SPD repository for DS results are made using a key that represent (a cleaned version of) the DS SQL that generated the result in the first place

As usual, feedbacks / corrections / additions are very much welcome!


2 Comments

Which Observations would you like to see in SQLd360?

SQLd360 v1617 finally includes a new “Observations” section (section 1F) that I pushed back for long, very long 🙂

If you are not familiar with SQLTXPLAIN then consider the reports in this section like “yellow flags”, specific items that are not necessarily causing direct troubles to your SQL but are still questionable and need further investigation / verification / blessing for such item to be kept in place.

There are many reasons why I pushed back for a long time, first one being the results can be easily misleading and make you believe the underlying cause is A while maybe it’s Z. Another reason is most of the observations ended up just being informative with no action taken against them, still you had to scroll hundreds of them.
Because of what just said, combined with the need to keep the checks “useful”, the current list of observations is intentionally short (and incomplete as of now), it includes only observations for:

  • Some system-wide settings, e.g. CBO parameters, OFE version, etc
  • Few plan and cursor-specific information, e.g. index referenced in some plan is now missing
  • Table statistics, e.g. partition that are empty according to stats

The list won’t grow much based on my ideas for the same reason it’s short now, I don’t want to implement checks I believe are important when 99% of the people don’t care about them.

That’s why this blog post, I need your feedback and ideas to implement what you care about 🙂
Let me know what you would like to have in the observation section and I’ll work on it!
Just keep in mind the goal is to keep that section relatively fast so super-complex checks that take 10 mins to execute are off the list.

Note: v1617 also turns off a couple of less-used features like TCB and AWR reports by default (can easily be enabled back via config file) so don’t be surprised if they don’t show up in column 5.


8 Comments

Execution plan tree temperature


During the Xmas holidays I made several additions to SQLd360 I had on my TODO list for quite a while, I’ll try to blog about the most important ones in the coming days.

Something I wanted to do for a long time was to make understanding execution plan easier, I hope the tree representation introduced here achieved such goal.

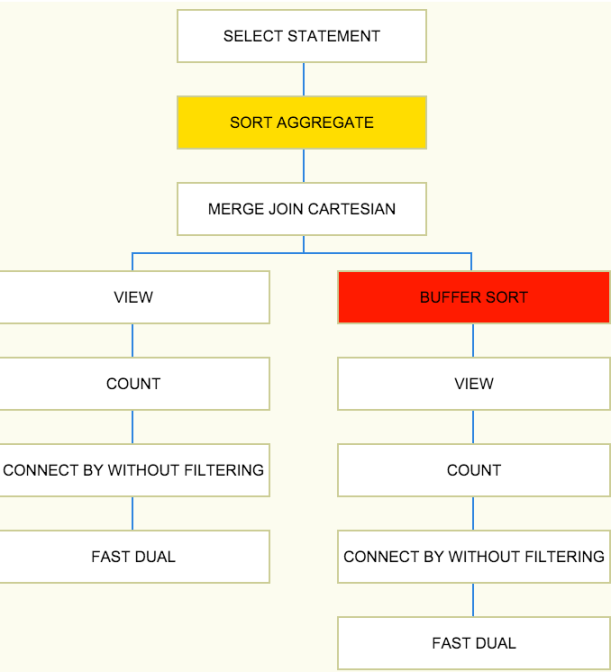
SQLd360 v1601 takes this chart a step further, marking nodes with different colors depending on how often such execution plan step shows up in ASH. Basically depending on “how hot” (the temperature) each step is a color between yellow and red is used to color the node, making it easier to determine in which section of the plan you should put your attention.
All those steps that never show up in ASH are represented in white.

So in example a silly SQL like the following takes 21 secs in my database

select count(*) 
  from (select rownum n1 from dual connect by rownum <= 10000),   
       (select rownum n1 from dual connect by rownum <= 100000)

------------------------------------------------------------------------
| Id  | Operation                         | Name | E-Rows | Cost (%CPU)|
------------------------------------------------------------------------
|   0 | SELECT STATEMENT                  |      |        |     4 (100)|
|   1 |  SORT AGGREGATE                   |      |      1 |            |
|   2 |   MERGE JOIN CARTESIAN            |      |      1 |     4   (0)|
|   3 |    VIEW                           |      |      1 |     2   (0)|
|   4 |     COUNT                         |      |        |            |
|   5 |      CONNECT BY WITHOUT FILTERING |      |        |            |
|   6 |       FAST DUAL                   |      |      1 |     2   (0)|
|   7 |    BUFFER SORT                    |      |      1 |     4   (0)|
|   8 |     VIEW                          |      |      1 |     2   (0)|
|   9 |      COUNT                        |      |        |            |
|  10 |       CONNECT BY WITHOUT FILTERING|      |        |            |
|  11 |        FAST DUAL                  |      |      1 |     2   (0)|
------------------------------------------------------------------------

18 ASH samples captured the execution on the BUFFER SORT step and 3 samples captured the SORT AGGREGATE.

The execution plan tree temperature looks like this

Screen Shot 2016-01-06 at 5.56.28 PM

Hopefully this will make it easier for people who don’t look into execution plans all the day to quickly spot where they should focus their attention 😀


Leave a comment

Partial fetch from SQL*Plus

This post is more a reminder to myself on how to perform “partial” FETCH in SQL*Plus with no need to use PL/SQL. I’ll need this post in the future for sure since I seem to forget it over time.

By partial I mean FETCH N rows and then wait, leaving the cursor open. This is similar to PL/SQL when the LIMIT parameter is used in a BULK COLLECT or to what the Siebel Connector does when fetching row to fill up a page on the screen. This is also the behavior Oracle expects your application to have when you set FIRST_ROWS_n optimization mode (and this is the whole point of simulating something like this 🙂

Assuming you want to FETCH 10 rows at a time, in SQL*Plus

SQL> set arraysize 10 pagesize 13 pau on

In details:

  • arraysize determines how many rows to fetch at a time
  • pagesize determines the number of lines in each page
  • pause instructs SQL*Plus to stop and wait for you to press ENTER for the next

The trick is to have each row from the rowset account for 1 row in the page otherwise such row will consume more “space” out of the pagination and FETCH will bring more rows than actually displayed (which is not a big deal but over time you will get a page with no need to execute any FETCH). The value 13 in this case accounts for 10 rows from the FETCH plus 1 row for the columns names, one for the line below the column name and one for the empty line above.

SQL> select object_id from dba_objects;


 OBJECT_ID
----------
        20
        46
        28
        15
        29
         3
        25
        41
        54
        40


 OBJECT_ID
----------
        26
        17
        13
         9
        43
        51
        38
         7
        56
        19


 OBJECT_ID
----------
        14
         6
        44
        21
        45
        35
         5
        23
        47
        24

and from the SQL trace

PARSING IN CURSOR #140058741813400 len=33 dep=0 uid=94 oct=3 lid=94 tim=501040793433 hv=1491819215 ad='83d99250' sqlid='ch9x9ppcfqqqg'
select object_id from dba_objects
...
FETCH #140058741813400:c=1036,e=1367,p=0,cr=9,cu=0,mis=0,r=1,dep=0,og=1,plh=2969894235,tim=501040794966
...
FETCH #140058741813400:c=0,e=72,p=0,cr=7,cu=0,mis=0,r=10,dep=0,og=1,plh=2969894235,tim=501040795575
...
FETCH #140058741813400:c=0,e=64,p=0,cr=1,cu=0,mis=0,r=10,dep=0,og=1,plh=2969894235,tim=501041831892
...
FETCH #140058741813400:c=0,e=68,p=0,cr=1,cu=0,mis=0,r=10,dep=0,og=1,plh=2969894235,tim=501045599796

Little disclaimer: because SQL*Plus fetches 1 row only on the first FETCH call we get 1 row “leftover” from one call that we carry to the next. Basically the first page needs 2 calls to fill up the screen, while from the second on we fetch 10 rows but fill the screen with the 1 from the previous call plus 9 from the current call. This is why there are 4 FETCH calls to fill up 3 pages.


5 Comments

TEMP I/O and Linux TMPFS

There are already several articles on the web about how to speed up TEMP I/O in an Oracle database (I really like this one from Alex Fatkulin) , specially since even the cool and fancy Engineered Systems still behave pretty much the same when it comes to spilling to disk, so probably this blog post is not going to show anything new but at least it can work as a reminder for me 🙂

I have an artificial SQL (pretty ugly to be honest) that spills to disk, around 665M

select count(distinct c1)
  from (select c1 
          from (select rownum||lpad('x',999,'x') c1 from dual connect by rownum <= 5*1e4), 
               (select rownum n1 from dual connect by rownum <= 1e2))

this is the result from SQL Monitor on 12.1.0.2 (I’m using the Oracle DB Developer VM)Screen Shot 2015-04-28 at 8.49.45 PM

Considering TEMP data doesn’t require any kind of persistency, redundancy and recoverability we can considering creating the TEMP tablespace on a file under tmpfs/ramfs. I like tmpfs a little better just because it has the ability to stop growing in size (even though it might swap hence reducing the benefit of going to memory).
From Linux

mount -o size=1G -t tmpfs none /mnt/mytmpfs

and then from SQL*Plus

SQL> create temporary tablespace TEMP2 tempfile '/mnt/mytmpfs/temp2.f' size 1G;
SQL> alter user mpagano temporary tablespace temp2;

and this is the result for the same SQL when using the new shiny TEMP2 tablespaceScreen Shot 2015-04-28 at 9.06.52 PM

Notice how the same amount of data has been spilled to disk but the elapsed time is half and the “direct path write temp” is basically gone.

DISCLAIMER: There are a few “oddities” in the both reports, the 0 buffer gets and no “direct path read temp” in the first one and the absence of the “direct path write temp” in the second one, my educated guess is the combination of low number of samples (the SQL is fast in both cases so number of samples is low) combined with the low wait time for the events (the VM writes to a file that could benefit from caching) could justify why not all the info are captured.


1 Comment

Bye Oracle…

Not a technical post this time, just a heads up on some changes…

Today is my last day with Oracle after almost 10 years.
The journey started in Italy as part of Oracle Consulting back in 2005 and it ended today in the US as Support engineer.
During this time I met a lot of great people and I really hope I did some good (not up to me to say though 😉
All the tools I inherited from Carlos Sierra (SQLT, SQLHC, Trace Analyzer, etc etc) will be maintained by Abel Macias, a good friend of mine and one of the people who contributed so much in making SQLT the great tool it is today.

Tomorrow I’ll be joining the Enkitec family, I’m very excited about working with so many great people and I look forward to the challenges this new job will bring!


3 Comments

As a first post…a bookmark for the tools on My Oracle Support

When talking about troubleshooting Oracle issues I sometime find myself in conversations like “I’ve this problem ABC and I’m trying to understand what’s happening” so at that point I jump in and ask “why didn’t you use [tool XYZ|script 123|etc] ?”… well the answer is usually “I didn’t even know it existed, where can I find it? why is it not advertised anywhere?”

That’s why for my first post I decided to make a list of the tools available on MOS that I usually use and where to find them.
They are all free to download and use, you just need a valid MOS account

SQLTXPLAIN (SQLT) – *THE* tool when it comes to SQL Tuning… and not only
SQLHC – A reduced version of SQLT focused on Health-Checks… and more
MVHC – A set of Health-Checks focused on the good health of your Mviews
PXHC – A set of Health-Checks focused on the Parallel Execution setup/configuraton
VERSION_RPT – A script to collect and format info from V$SQL_SHARED_CURSOR
PROCWATCHER – A tool to monitor and examine Oracle and Clusterware processes at an interval

There are some other great tools I have in my swiss-knife directory that are not coming from MOS like EDB360 and Snapper.
I suggest you google them and make sure to have them ready!