Last week I was in Dallas, TX for Hotsos 2015 and I had a few questions on how to read an execution plan so I thought why not including in SQLd360 an alternative representation of the execution plan, maybe one that is easier to understand and closer to the academic explanation of the execution plan as a tree.
The main improvements for version v1504 (released yesterday, March 8th) are around execution plans analysis, there is a new link “Plans analysis” in the Plans section with a few new reports, all organized by PHV.
Basically this new page will show N columns where N is the number of distinct plans for the SQL we focus on and for each PHV we have
- Plan Tree
- Average elapsed time per execution (recent and historical) from ASH
- Top 15 wait events
- Top 15 objects accessed
- Top 15 execution plan step id / operation
The plan tree is an organizational chart where the execution plan is represented as a tree upside-down where the first operation executed is the first leaf on the extreme left and the next operation is the next left (walking from left to right) and where each couple (or more) nodes are combined together by their parent node.
Ie. in the following execution plan the first step is #5 but somebody might be tricked thinking it’s #13 (or #7) since more indented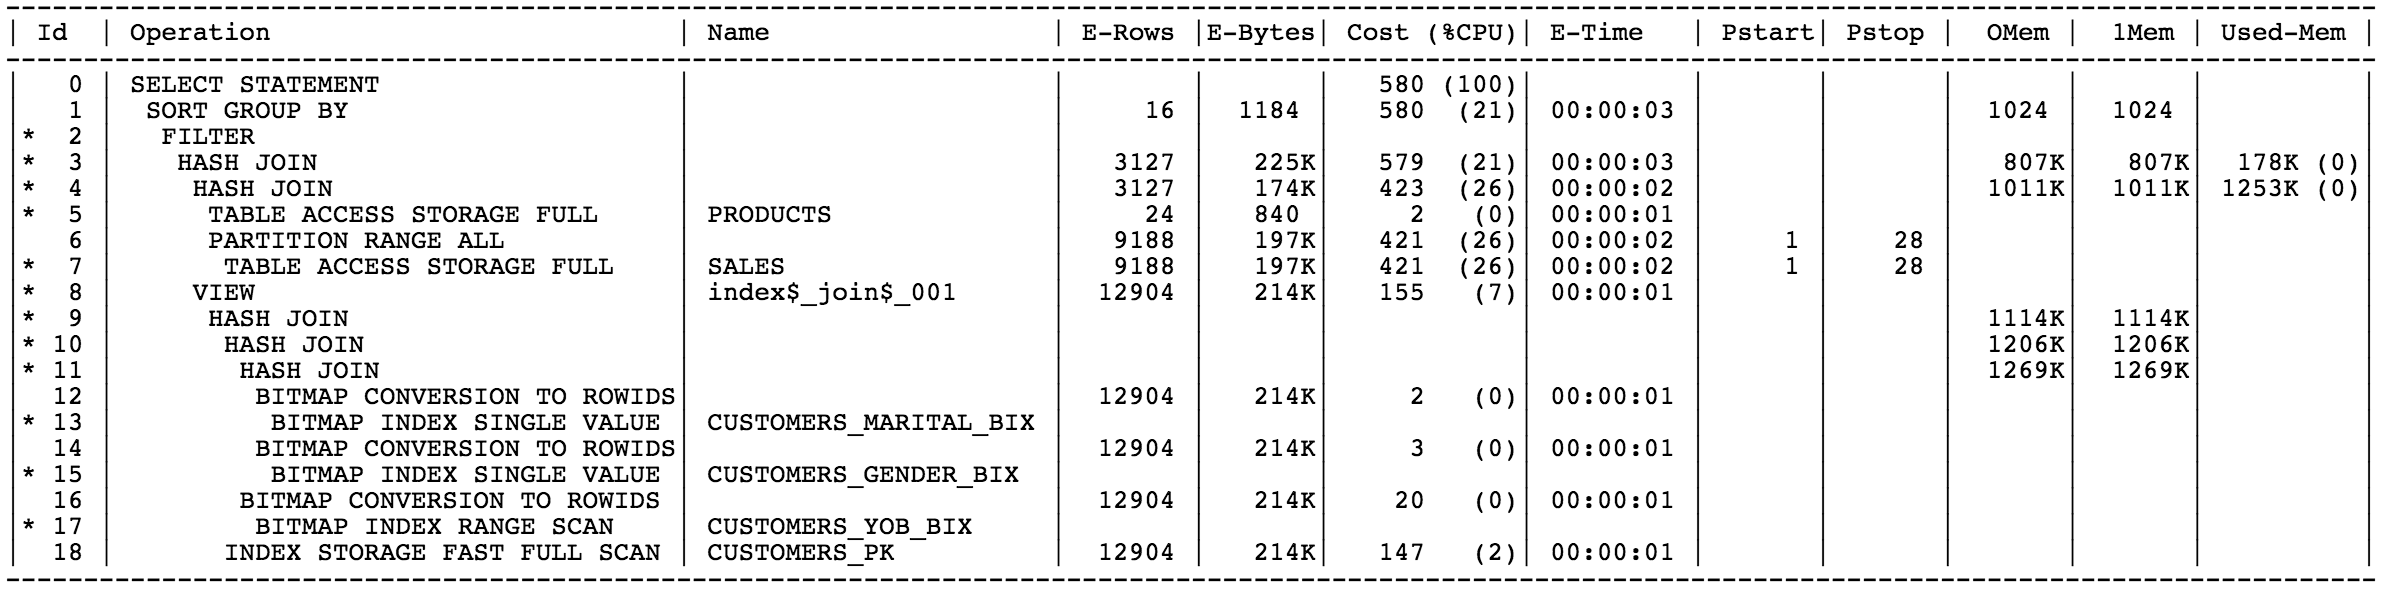
while looking at the new chart is way easier to understand that step #5 is indeed the first one executed
Hopefully you will like it too!!
Other small additions for v1504 are Optimizer system statistics, Segments/Objects information and fixes here and there that (hopefully) reduce the number of bugs in the code 🙂

Pingback: SQL Plan Tree Visualization | Vishal desai's Oracle Blog