Mauro Pagano's Blog


1 Comment

Trouble reading an execution plan? Maybe SQLd360 can help!

Last week I was in Dallas, TX for Hotsos 2015 and I had a few questions on how to read an execution plan so I thought why not including in SQLd360 an alternative representation of the execution plan, maybe one that is easier to understand and closer to the academic explanation of the execution plan as a tree.

The main improvements for version v1504 (released yesterday, March 8th) are around execution plans analysis, there is a new link “Plans analysis” in the Plans section with a few new reports, all organized by PHV.
Basically this new page will show N columns where N is the number of distinct plans for the SQL we focus on and for each PHV we have

  • Plan Tree
  • Average elapsed time per execution (recent and historical) from ASH
  • Top 15 wait events
  • Top 15 objects accessed
  • Top 15 execution plan step id / operation

The plan tree is an organizational chart where the execution plan is represented as a tree upside-down where the first operation executed is the first leaf on the extreme left and the next operation is the next left (walking from left to right) and where each couple (or more) nodes are combined together by their parent node.

Ie. in the following execution plan the first step is #5 but somebody might be tricked thinking it’s #13 (or #7) since more indentedScreen Shot 2015-03-09 at 10.21.40 PM

while looking at the new chart is way easier to understand that step #5 is indeed the first one executedplan

Hopefully you will like it too!!

Other small additions for v1504 are Optimizer system statistics, Segments/Objects information and fixes here and there that (hopefully) reduce the number of bugs in the code 🙂


5 Comments

SQLd360 v3 now available, new features and (hopefully) less bugs!

Couple of weeks ago SQLd360 v1 came out and now v3, so what happened to v2? It was a “silent” release to fix a bug and sneak in a couple features I didn’t complete in time for v1 but most of the new features are in v3.
The main page now looks something like thisScreen Shot 2015-02-26 at 10.01.13 PM

so the list of content grew a bit and it will keep growing release after release.
List of bugs (hopefully) shrank as well but no promise on that 🙂

The major additions are

  • Plan Control section reporting info about SQL Profiles, SQL Plan Baselines and SQL Patches
  • Execution plans details from SQL Plan Baselines
  • Time series report/chart for average and median elapsed for the SQL (regardless of the plan), this can help answer the question “how is my SQL doing over time?”
  • Time series report/chart for average elapsed time per plan hash value for the SQL, this can help identify if a change in performance is caused by a plan change
  • A standalone script to execute the SQL from SQL*Plus, the script includes bind variables definition/assignment in case the SQL has binds
  • Cursor Sharing section reporting info from GV$SQL_SHARED_CURSOR
  • Bind datatype mismatch report, this can help identify those cases where apps define binds for the same SQL using different datatypes

plus some other minor reports/tweaks.

Bug fixes here and there, specially in the histograms section where now every endpoint value is (AFAIK, if you see issues let me know so I can fix them!) properly converted and charted so we can leverage charts to analyze histograms 😀
Ie the following one is for SH.CUSTOMERS.CUST_YEAR_OF_BIRTHhistogram

From the chart above we can see how the data is distributed and for each bar(/bucket) the (approximate) value, how many rows belong to each bucket and the selectivity for an equality predicate for that specific value.

More things in the work and as usual feedback/comments/reported issues are very much welcome!!!!


73 Comments

SQLd360, SQL diagnostics collection made faster

Another tool to help with SQL Tuning? Yes! Hopefully with some advantage over what you used until today 🙂

Collecting diagnostics around a SQL is not fun, if you’ve been there you know that. It requires to extract info from several different places, the amount is high and it’s time-sensitive aka you should do it as quick as possible so that things around the SQL don’t change!

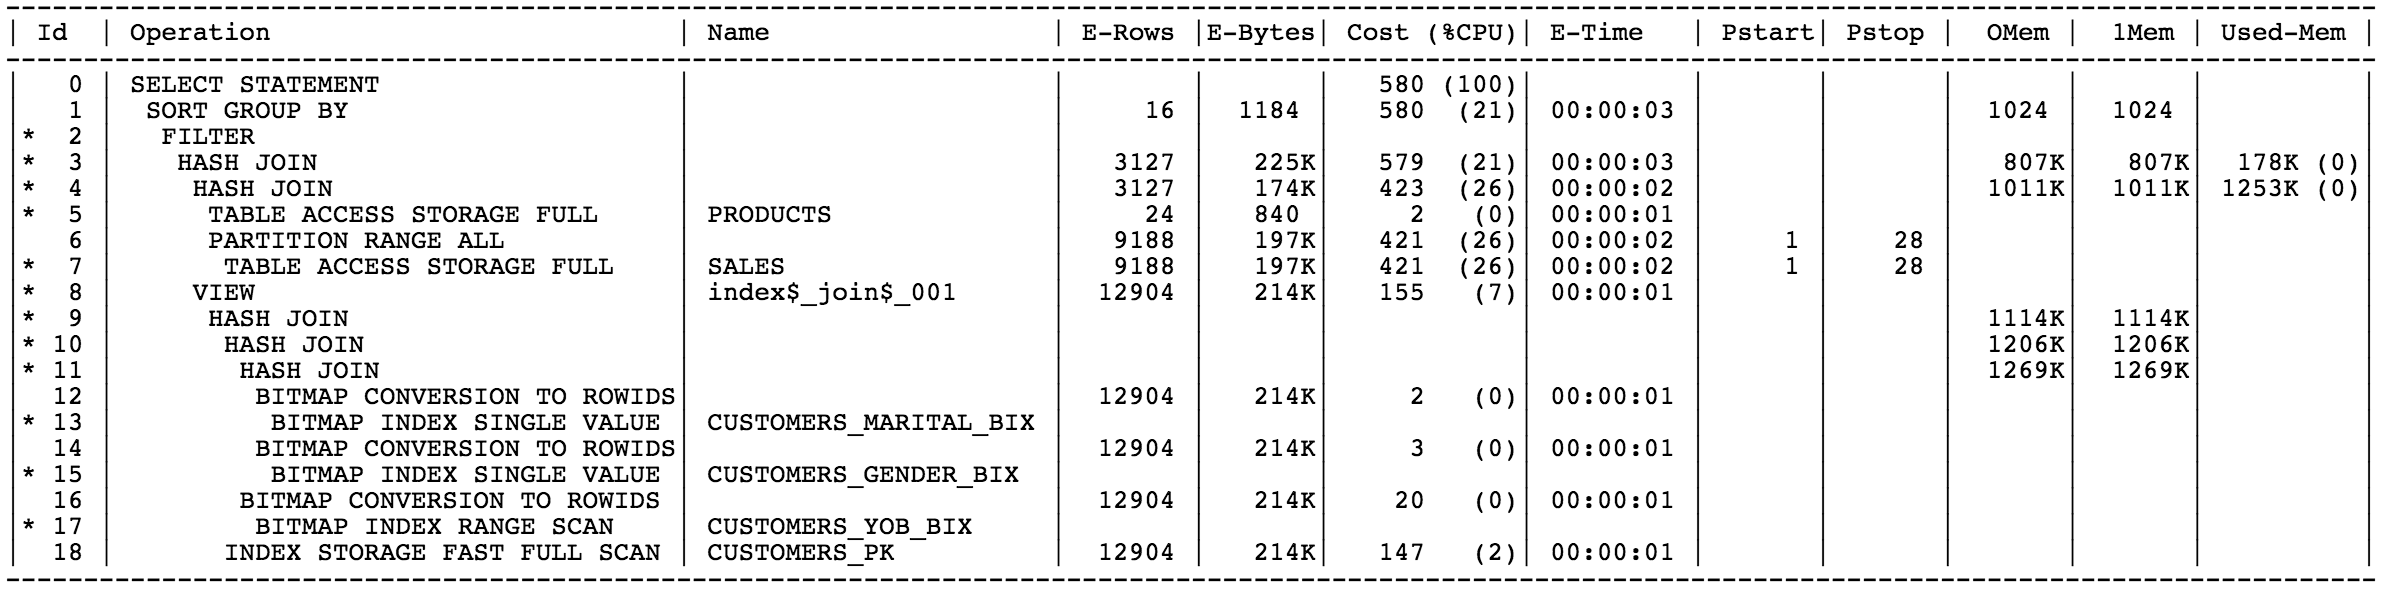
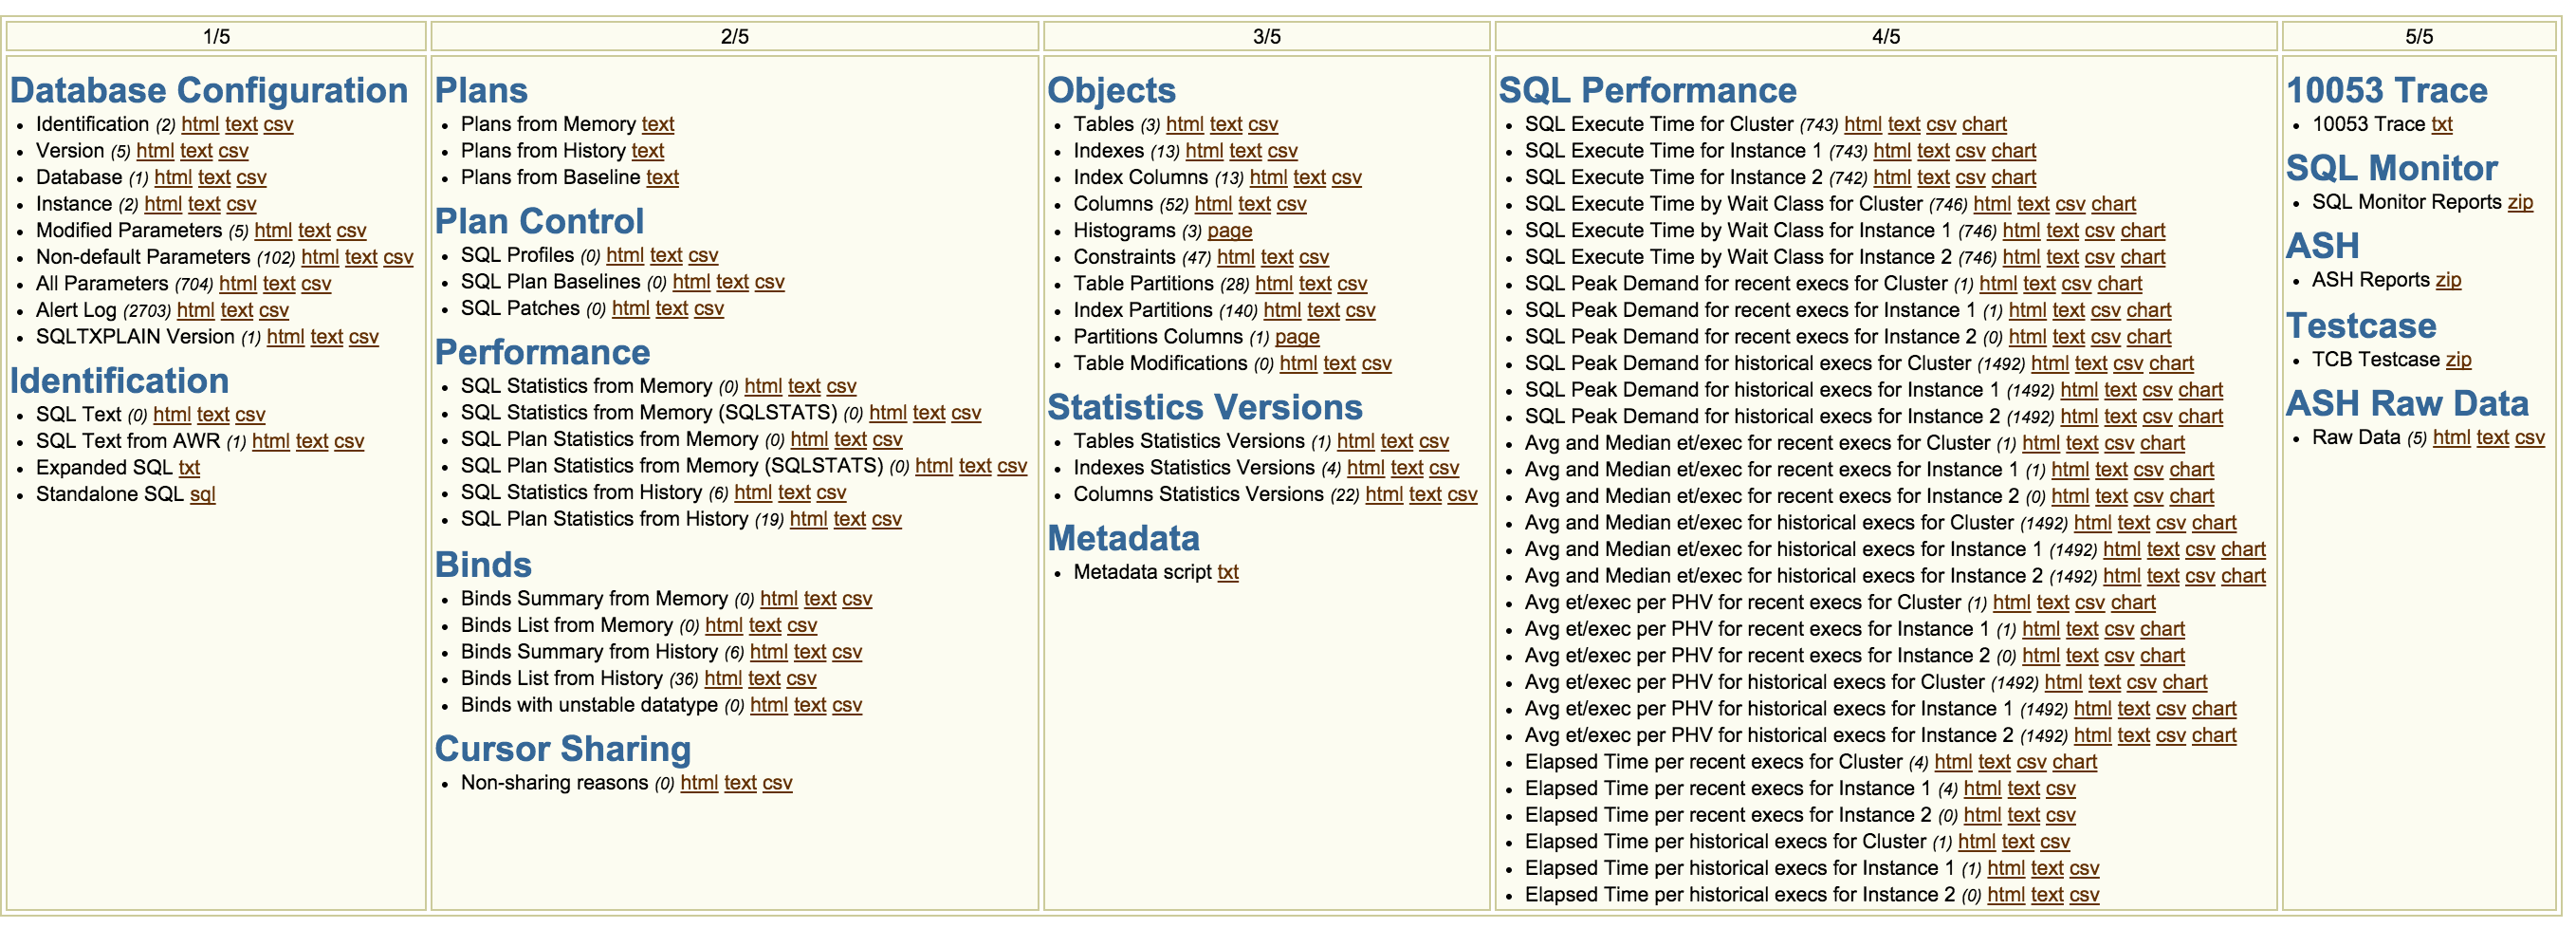
SQLd360 is a free tool that provides a 360-degree overview around a SQL statement. The output is a single zip file that allows offline analysis, trend analysis and detailed root-cause investigations. The content of the zip is a set of small reports, each specific to an area of interest, easy to navigate through an index file.

SQLd360 doesn’t require any installation and can be executed by any user that has access to dictionary views. The tool can be used by DBAs, Developers, SysAdmin, etc to investigate several aspects of the SQL, not only in terms of isolated execution but also in the context of the overall database impact, it can also help with trend analysis.
The list of contents is going to grow (fast) with time so make sure you use the latest version.

SQLd360 works successfully in 10g, 11g and 12c, specifically on Linux/Unix platforms, it has not been tested on Windows.

If what described so far sounds familiar then you are probably right. SQLd360 has been created to complement eDB360 tool created by Carlos Sierra. The design is similar but at the same time different having to deal with different challenges.
SQLd360 is also included in eDB360 starting version v1504.

Download

SQLd360 is free, you can download it from either GitHub or from the link under the Download section on the sidebar of this blog.

Instructions

Download SQLd360 and review the README.txt file included.
Unzip sqld360-master.zip on the database server and navigate to the master directory.
Connect to the database as any other user with access to dictionary views (SYS not recommended) and start sqld360.sql

SQLd360 has two input parameters

  1. SQL ID – SQL ID for which SQLd360 will collect diagnostics.
  2. License – SQLd360 extracts information from both AWR (licensed by Oracle under the Diagnostics Pack) and SQL Monitoring repository (part of the Oracle Tuning Pack). This parameter accepts one of 3 values: “T”, “D” or “N”. If your database is licensed under the Oracle Tuning Pack, enter then the value of “T”. If your database is not licensed to use the Oracle Tuning Pack but it is licensed to use the Oracle Diagnostics Pack, enter “D” then. If your site is not licensed on any of these two Oracle Packs, enter “N” then. Be aware that a value of “N” reduces substantially the content and value of the output. Thus the preferred parameter value is “T” (Oracle Tuning Pack).

Sample

# unzip sqld360-master.zip
# cd sqld360-master
# sqlplus / as sysdba
SQL> @sqld360.sql 0vy6pt4krb3gm T

SQLd360 usually completes within a few minutes but it can take longer in case the amount of data to analyze in AWR/ASH is significant. The output file can reach up to 100Mb so make sure the directory where the tool is executed from has enough free space.

Feedback
For any feedback please post on this blog or just email me directly.