Mauro Pagano's Blog


1 Comment

Manually holding an enqueue with SystemTap

This week I stumbled into a system that exposed some contention on an enqueue I never saw before as a cause of troubles, the MS enqueue. The description is pretty straightforward, from V$LOCK_TYPE

SQL> select type, name, id1_tag, id2_tag, description from v$lock_type where type = 'MS';

TYP NAME                           ID1_TAG                        ID2_TAG    DESCRIPTION
--- ------------------------------ ------------------------------ ---------- -----------------------------------------------------------
MS  Materialized View Refresh Log  master object #                0          Lock held during materialized view refresh to setup MV log

so it’s easy to get an idea of which components are involved but I wanted to dig a little more around it.

Spoiler alert, this post is not about enq MS contention 🙂

I wanted to be able to hold an enqueue for as long as I wanted so that I could fire other sessions and see under which conditions they would end up waiting on the enqueue holder. An enqueue version of what is described here for latches (as usual amazing job by Tanel and Andrey!).

There are already a couple of scripts (that I found, there are probably more) for dtrace to achieve similar tasks (here and here), specially the one from Mikhail does exactly what I wanted. Anyway my VM is on Linux OEL7 and I have no dtrace to play with so I went for SystemTap.

This is not as sophisticated as the latch mechanism where using oradebug we can just grab whatever latch, in this case we need to make our session voluntary “grab the resource” and the script will just prevent the session from releasing it. Also I didn’t need all the features in Mikhail script (ie. block it only for a specific obj#) so I kept it simple to start.

I just needed to identify the enqueue for my resource and stop the process from releasing it once done with it (I’ll skip the description of the structures involved since they are already explained in both Tanel’s and Mikhail’s scripts).

The MS is X$KSIRESTYP.INDX 167 in 12.1.0.2

SQL> select rest.indx i, rest.resname type from X$KSIRESTYP rest, X$KSQEQTYP eqt where (rest.inst_id = eqt.inst_id) and   (rest.indx = eqt.indx) and   (rest.indx > 0) and rest.resname = 'MS';

         I TYP
---------- ---
       167 MS

so the script looks something like this

[oracle@localhost systemtap]$ cat trace_eq.stp
global enqAddress
global target_eq = 167;
global getTime

probe process("oracle").function("ksqgtlctx") {
     if (int_arg(5) == target_eq) {
         enqAddress = s64_arg(1);
	 getTime    = gettimeofday_us();
         printf("%d function=%s getting enqueue: pid=%d enqAddress=0x%x locktype#=%d\n", getTime, usymname(ustack(0)), pid(), enqAddress, int_arg(5));
     }
}

probe process("oracle").function("ksqr*") {
   if(s64_arg(1) == enqAddress) {
       releaseTime = gettimeofday_us();
       heldTime = releaseTime - getTime;
       printf("%d function=%s releasing enqueue: pid=%d enqAddress=0x%x held for=%d us \n", releaseTime, usymname(ustack(0)), pid(), s64_arg(1), heldTime);
       raise(%{ SIGSTOP %});
    enqAddress = 0;
   }
}

In a nutshell, the script keeps track of the enqueue address for the enqueue protecting the resource of interest (167 here) and it stops the process (SIGSTOP) once it’s trying to release it. The function uses a wildcard “ksqr*” because different functions release different enqueues (ie. MS is released by ksqrcli, TM is released by ksqrcl).

Assuming my user process is PID 4202 (sid 142), we can make it stop while holding MS just loading the stap script

[oracle@localhost systemtap]$ stap -g trace_eq.stp -x 4202

and trigger a refresh (since the enq MS “has something to do” with MV refresh from what V$LOCK_TYPE told me) from the user session pid 4202

SQL> exec dbms_snapshot.refresh('TEST_MV');

on the stap terminal you’ll see something like

1436194076252628 function=ksqgtlctx getting enqueue: pid=4202 enqAddress=0x86c38a70 locktype#=167
1436194076295783 function=ksqrcli releasing enqueue: pid=4202 enqAddress=0x86c38a70 held for=43155 us

and the session PID 4202 will indeed be stopped, while holding the MS enqueue

SQL> select * from v$lock where sid = 142;

       SID TYP        ID1        ID2      LMODE    REQUEST      CTIME      BLOCK
---------- --- ---------- ---------- ---------- ---------- ---------- ----------
       142 AE         133          0          4          0      69961          0
       142 MS       96149          0          6          0        352          0
       142 JI      103680          0          6          0        353          0

Now I can fire all the sessions I want and see under which conditions they get blocked, under which stack, etc etc.
To make the user session resume just CTRL+C the stap script and send a SIGCONT signal to the process (kill -s SIGCONT).

This is just a very raw script to make a process stop while holding an enqueue, it has a lot of limitations and several refinements should be implemented to match the functionalities of the other scripts mentioned before, so don’t expect much from it 🙂


3 Comments

Missing a Bloom filter…

The other day I stumbled into an execution plan that made me pause for a while so hopefully if you see something similar tomorrow you will save some time 🙂

The plan was about 100 steps long but a specific join is where I want to focus on so stripping all the “noise” I reproduce it in house with the following steps and got to a plan that looked like this .

create table mydim (filter1 number, col1 number);
create table myfact (col1 number, col2 number)
partition by range(col1)
subpartition by hash(col2)
subpartitions 16
(partition p1 values less than (5),
 partition p2 values less than (10),
 partition p3 values less than (15),
 partition p4 values less than (20),
 partition p5 values less than (25));
insert into mydim select mod(rownum,10), rownum from dual connect by rownum <= 100;
insert into myfact select mod(rownum,25), rownum from dual connect by rownum <= 100000;
commit;
exec dbms_Stats.gather_table_stats(user,'MYDIM');
exec dbms_Stats.gather_table_stats(user,'MYFACT');
alter table myfact parallel 2;

select count(*) 
  from myfact, mydim 
 where mydim.filter1 = 3 
   and mydim.col1 = myfact.col2;

--------------------------------------------------------------------------------------
| Id |Operation                          |Name    |Rows  |Cost (%CPU)| Pstart| Pstop |
--------------------------------------------------------------------------------------
|   0|SELECT STATEMENT                   |        |    1 |  558   (1)|       |       |
|   1| SORT AGGREGATE                    |        |    1 |           |       |       |
|   2|  PX COORDINATOR                   |        |      |           |       |       |
|   3|   PX SEND QC (RANDOM)             |:TQ10001|    1 |           |       |       |
|   4|    SORT AGGREGATE                 |        |    1 |           |       |       |
|*  5|     HASH JOIN                     |        |   10 |  558   (1)|       |       |
|   6|      BUFFER SORT                  |        |      |           |       |       |
|   7|       PART JOIN FILTER CREATE     |:BF0000 |   10 |    3   (0)|       |       |
|   8|        PX RECEIVE                 |        |   10 |    3   (0)|       |       |
|   9|         PX SEND BROADCAST         |:TQ10000|   10 |    3   (0)|       |       |
|* 10|          TABLE ACCESS FULL        |MYDIM   |   10 |    3   (0)|       |       |
|  11|      PX PARTITION HASH JOIN-FILTER|        |  100K|  555   (1)|:BF0000|:BF0000|
|* 12|       TABLE ACCESS FULL           |MYFACT  |  100K|  555   (1)|     1 |    80 |
--------------------------------------------------------------------------------------

Predicate Information (identified by operation id):
---------------------------------------------------
   5 - access("MYDIM"."COL1"="MYFACT"."COL2")
  10 - filter("MYDIM"."FILTER1"=3)
  12 - filter(SYS_OP_BLOOM_FILTER(:BF0001,"MYFACT"."COL2"))

So it’s a two table join where a Bloom filter (BF0000) is created based on the data extracted from MYDIM and it’s later used to prune on MYFACT, the strange part is the FTS at step 12 uses another Bloom Filter (BF0001) that is nowhere to be found in the plan.

MYFACT is RANGE partitioned on COL1 and HASH subpartitioned on COL2 and BF0000 is used to determine which subpartitions to scan. Being the table composite partitioned combined with BF pruning the risk of getting into something like this was high, but in my case I did have an evidence of a BF applied in Pstart/Pstop, I just didn’t have any evidence of where the other BF came from.
One of the things I usually do when I can’t figure out something is prove those things that look legit first to determine what can be trusted and what not (it helps a lot when working wrong results).
Is it just a display glitch in the filter section and BF0001 should be BF0000? or is it a display glitch in the plan that is missing some steps? Is BF0000 even used to prune? Is BF0001 really used to skip rows? etc etc.

First step was to prove BF0000 was indeed used to prune. Event 10128 tracks down pruning info during execution so it’s a great way to confirm things if you can run the SQL, details here.
From one of the slaves trace (call time RUN is the only one in the slaves trace, the others are in the QC one):

Partition Iterator Information:
  partition level = ABSOLUTE
  call time = RUN
  order = ASCENDING
  Partition iterator for level 1:
   iterator = RANGE [0, 4]
   index = 0
partition iterator for level 2:
   iterator = ARRAY [count= 8, max = 16] = { 2 3 4 5 6 13 14 15 }
   index = 2

Level 1/2 is the partition/subpartition level so from the trace above we accessed all the partitions (no surprise here because there is no filter on col1) but accessed only 8 subpartitions out of 16 so looks like BF0000 was indeed used to skip partitions. When you use this trace just remember partition “IDs” are counted from 0 while partition_position in the dictionary starts from 1 so the numbers are all shifted by 1 (ie. the subpartition 2 above is indeed the 3rd one).

Next step was to verify if BF0001 is really used to filter out rows on the FTS or not so I added a comment on the SQL to make the SQL ID different and ran it again so that I could use format=>’ALLSTATS ALL’ to get aggregated stats from all the slaves+QC.

select * from table(dbms_xplan.display_cursor(null,null,'ALLSTATS ALL'));
select /* B */ count(*) from myfact, mydim where mydim.filter1 = 3 and mydim.col1 = myfact.col2

-----------------------------------------------------------------------------------------
| Id |Operation                          |Name    |Starts|E-Rows |Pstart |Pstop  |A-Rows|
-----------------------------------------------------------------------------------------
|   0|SELECT STATEMENT                   |        |     1|       |       |       |     1|
|   1| SORT AGGREGATE                    |        |     1|     1 |       |       |     1|
|   2|  PX COORDINATOR                   |        |     1|       |       |       |     2|
|   3|   PX SEND QC (RANDOM)             |:TQ10001|     0|     1 |       |       |     0|
|   4|    SORT AGGREGATE                 |        |     2|     1 |       |       |     2|
|*  5|     HASH JOIN                     |        |     2|    10 |       |       |    10|
|   6|      BUFFER SORT                  |        |     2|       |       |       |    20|
|   7|       PART JOIN FILTER CREATE     |:BF0000 |     2|    10 |       |       |    20|
|   8|        PX RECEIVE                 |        |     2|    10 |       |       |    20|
|   9|         PX SEND BROADCAST         |:TQ10000|     0|    10 |       |       |     0|
|* 10|          TABLE ACCESS FULL        |MYDIM   |     1|    10 |       |       |    10|
|  11|      PX PARTITION HASH JOIN-FILTER|        |     2|   100K|:BF0000|:BF0000|    10|
|* 12|       TABLE ACCESS FULL           |MYFACT  |    80|   100K|     1 |    80 |    10|
-----------------------------------------------------------------------------------------

Each partition has 20k rows and each subpart around 1250 so in absence of BF applied the FTS would return 50k rows (1250 rows per subpart * 8 subpart * 5 part) but the A-Rows shows the number of rows was 10 (this time, during other runs sometime little higher) so it really looks like BF0001 existed and was applied.

So BFs are real and are used, time to doubt the exec plan.
The easiest way to do it was to test in a future version, the plan above came from 11.2.0.4 so it was natural to test 12.1.0.2 and surprise surprise, the plan made much more sense over there:

---------------------------------------------------------------------------------------
| Id |Operation                           |Name    |Rows  |Cost (%CPU)| Pstart| Pstop |
---------------------------------------------------------------------------------------
|   0|SELECT STATEMENT                    |        |    1 |12114   (1)|       |       |
|   1| SORT AGGREGATE                     |        |    1 |           |       |       |
|   2|  PX COORDINATOR                    |        |      |           |       |       |
|   3|   PX SEND QC (RANDOM)              |:TQ10001|    1 |           |       |       |
|   4|    SORT AGGREGATE                  |        |    1 |           |       |       |
|*  5|     HASH JOIN                      |        |   10 |12114   (1)|       |       |
|   6|      BUFFER SORT                   |        |      |           |       |       |
|   7|       JOIN FILTER CREATE           |:BF0001 |   10 |    3   (0)|       |       |
|   8|        PART JOIN FILTER CREATE     |:BF0000 |   10 |    3   (0)|       |       |
|   9|         PX RECEIVE                 |        |   10 |    3   (0)|       |       |
|  10|          PX SEND BROADCAST         |:TQ10000|   10 |    3   (0)|       |       |
|* 11|           TABLE ACCESS FULL        |MYDIM   |   10 |    3   (0)|       |       |
|  12|      JOIN FILTER USE               |:BF0001 |  100K|12111   (1)|       |       |
|  13|       PX PARTITION HASH JOIN-FILTER|        |  100K|12111   (1)|:BF0000|:BF0000|
|* 14|        TABLE ACCESS FULL           |MYFACT  |  100K|12111   (1)|     1 |    80 |
---------------------------------------------------------------------------------------

Predicate Information (identified by operation id):
---------------------------------------------------
   5 - access("MYDIM"."COL1"="MYFACT"."COL2")
  11 - filter("MYDIM"."FILTER1"=3)
  14 - filter(SYS_OP_BLOOM_FILTER(:BF0001,"MYFACT"."COL2"))

and setting OFE=11.2.0.4 then plan switched back to the “strange” one so it was time for SQLT XPLORE starting from 12.1.0.2 and testing all the settings (parameter+fix_control) looking for one that would cause the plan “to go back to strange”. Outcome was fix for (internal) bug 12569316, unfortunately there is no backport on top of 11.2.0.4 so I couldn’t test if the fix itself is enough or it needs some other code change to display the missing step.

At least I’m now positive such step should indeed be present in the plan and in the future (12c) it’s going to be there 😀


8 Comments

Historical SQL Monitor reports in 12c!

I think SQL Monitoring is one of the greatest addition to the Oracle performance diagnostics world since a long time ago (10046-time maybe?) because it allows to collect in a single shot a long list of crucial information that are otherwise painful to extract and put together. The report provides a complete picture of the execution across processes (PX), nodes (RAC), etc etc.
On the other hand, one of the major limitations (the biggest one, imho) is SQL Monitor info are quickly aged out of memory and not stored in AWR (there is no DBA_HIST_SQL_MONITOR or similar) so they are are unlikely to be around for a post-mortem investigation.

Good news is in 12c we can pull a report for a historical execution, granted the execution was expensive enough to candidate for collection. I didn’t investigate the details of the automatic collection yet but there are two ways, details from DBA_HIST_REPORTS_CONTROL:

  • REGULAR – per-minute report capture subject to DBTIME budget
  • FULL_CAPTURE – capture will be run per minute without the DBTIME budget constraints

The FULL_CAPTURE can be enabled using DBMS_AUTO_REPORT.START_REPORT_CAPTURE/FINISH_REPORT_CAPTURE.

Info about each automatically collected report are stored in DBA_HIST_REPORTS and the report itself (in XML format) is stored in DBA_HIST_REPORTS_DETAILS.

The whole framework is also used for Real-Time ADDM so the DBA_HIST_REPORTS* views are not organized in a SQL Monitor-friendly way (ie. SQL ID/SQL Exec ID/SQL Exec Start) but rather in a report-oriented way, the key is REPORT_ID.
Column COMPONENT_NAME helps track down the source of the report, “sqlmonitor” in this case.
A summary of the report is stored in REPORT_SUMMARY in XML format, so a simple SQL like the following pulls the list of REPORT_ID/SQL_ID (plus anything else you may want to extract from the summary, ie. SQL Exec ID and SQL Exec Start):

SELECT report_id,
       EXTRACTVALUE(XMLType(report_summary),'/report_repository_summary/sql/@sql_id') sql_id,
       EXTRACTVALUE(XMLType(report_summary),'/report_repository_summary/sql/@sql_exec_id') sql_exec_id,
       EXTRACTVALUE(XMLType(report_summary),'/report_repository_summary/sql/@sql_exec_start') sql_exec_start
  FROM dba_hist_reports
 WHERE component_name = 'sqlmonitor'

From my system I have

 REPORT_ID SQL_ID          SQL_EXEC_I SQL_EXEC_START
---------- --------------- ---------- ------------------------------
      1022 fx439nus0rtcz     16777216 04/29/2015 13:34:15
      1024 fjvsmy2yujbqd     16777216 04/29/2015 13:40:00
      1025 9qn59dh1w8352     16777216 04/29/2015 13:41:12
      1026 1uqrk6t8gfny8     16777216 04/29/2015 13:41:14

Using the REPORT_ID we can now extract the report in different format (HTML, TEXT, ACTIVE, XML) using DBMS_AUTO_REPORT.REPORT_REPOSITORY_DETAIL

SQL> set long 10000000 longchunksize 10000000 pages 0
SQL> SELECT DBMS_AUTO_REPORT.REPORT_REPOSITORY_DETAIL(RID => 1022, TYPE => 'text')
       FROM dual;
SQL Monitoring Report

SQL Text
------------------------------
select count(*) from test_inmemory

Global Information
------------------------------
 Status             : DONE (ALL ROWS)
 Instance ID        : 1
 Session            : MPAGANO (12:35570)
 SQL ID             : fx439nus0rtcz
 SQL Execution ID   : 16777216
 Execution Started  : 04/29/2015 13:34:15
 First Refresh Time : 04/29/2015 13:34:15
 Last Refresh Time  : 04/29/2015 13:34:15
 Duration           : .064582s
 Module/Action      : SQL*Plus/-
 Service            : orcl
 Program            : sqlplus@Mauros-iMac.local (TNS V1-V3)
 Fetch Calls        : 1
.....

or if we want it in flashy ACTIVE format

SQL> set trimspool on
SQL> set trim on
SQL> set pages 0
SQL> set linesize 1000
SQL> set long 1000000
SQL> set longchunksize 1000000
SQL> spool historical_sqlmon.sql
SQL> SELECT DBMS_AUTO_REPORT.REPORT_REPOSITORY_DETAIL(RID => 1022, TYPE => 'active')
       FROM dual;

Screen Shot 2015-05-04 at 3.32.23 PM

Several details are missing from this post (and from my knowledge of how the whole framework works) but I’ll make sure to pass them along as soon as I find out more.

Hopefully this blog post will be useful next time you are trying to figure out why a SQL ran so slow last weekend 🙂

UPDATE: DBA_HIST_REPORTS also includes SQL_ID, SQL_EXEC_ID, SQL_EXEC_START and several other information (concatenated together into a single column and separated by ‘3#’ sign) as basic columns KEY1, KEY2, KEY3 and KEY4. The following SQL provides the same information as the original SQL posted in this blog post

SELECT report_id, key1 sql_id, key2 sql_exec_id, key3 sql_exec_start
  FROM dba_hist_reports
 WHERE component_name = 'sqlmonitor'


5 Comments

TEMP I/O and Linux TMPFS

There are already several articles on the web about how to speed up TEMP I/O in an Oracle database (I really like this one from Alex Fatkulin) , specially since even the cool and fancy Engineered Systems still behave pretty much the same when it comes to spilling to disk, so probably this blog post is not going to show anything new but at least it can work as a reminder for me 🙂

I have an artificial SQL (pretty ugly to be honest) that spills to disk, around 665M

select count(distinct c1)
  from (select c1 
          from (select rownum||lpad('x',999,'x') c1 from dual connect by rownum <= 5*1e4), 
               (select rownum n1 from dual connect by rownum <= 1e2))

this is the result from SQL Monitor on 12.1.0.2 (I’m using the Oracle DB Developer VM)Screen Shot 2015-04-28 at 8.49.45 PM

Considering TEMP data doesn’t require any kind of persistency, redundancy and recoverability we can considering creating the TEMP tablespace on a file under tmpfs/ramfs. I like tmpfs a little better just because it has the ability to stop growing in size (even though it might swap hence reducing the benefit of going to memory).
From Linux

mount -o size=1G -t tmpfs none /mnt/mytmpfs

and then from SQL*Plus

SQL> create temporary tablespace TEMP2 tempfile '/mnt/mytmpfs/temp2.f' size 1G;
SQL> alter user mpagano temporary tablespace temp2;

and this is the result for the same SQL when using the new shiny TEMP2 tablespaceScreen Shot 2015-04-28 at 9.06.52 PM

Notice how the same amount of data has been spilled to disk but the elapsed time is half and the “direct path write temp” is basically gone.

DISCLAIMER: There are a few “oddities” in the both reports, the 0 buffer gets and no “direct path read temp” in the first one and the absence of the “direct path write temp” in the second one, my educated guess is the combination of low number of samples (the SQL is fast in both cases so number of samples is low) combined with the low wait time for the events (the VM writes to a file that could benefit from caching) could justify why not all the info are captured.


2 Comments

Poor man SQL Monitor with SQLd360…kind of!

One of the most interesting section of a SQL Monitor report is IMHO the Metrics page where we can see on a timeline the impact / requirement on an execution in terms of CPU, IOPS, MBPS, PGA and TEMP.
Starting 11gR2, we can get something similar (not exactly the same) from ASH, this is from DBA_HIST_ACTIVE_SESS_HISTORY

Screen Shot 2015-04-27 at 9.37.15 AM

For each TM_DELTA_TIME we know how much CPU and DB Time has been spent, as well as how many RW IOPS and RW and Interconnect (M)BPS per DELTA_TIME. The metrics are accumulated and reported at the time of the ASH sample “over the Delta Time” that roughly matches with the ASH sampling one, so ie. from V$ACTIVE_SESSION_HISTORY we are able to see how many RW IOPS per second (since the DELTA_TIME is roughly going to be the second) are accounted by the session we focus on. Also each time the ASH sample is taken the PGA and TEMP consumed by the session at that time is tracked.

Starting SQLd360 v1511 those columns are now collected and aggregated/charted over time so we can look at the single consumption via SQL Monitor (or from raw ASH data) and at the same time evaluate the historical trend from SQLd360. The PlansAnalysis page in SQLd360 now looks something like this

Screen Shot 2015-04-27 at 10.54.29 AM

Other new additions since the last post (v1507) are:

  • SQLd360 now uses a configuration file to determine how many days to collect info for and which “major” external APIs to collect / ignore
  • Several reports have been rewritten to better represent info from Parallel Executions
  • New sections provide info on
    • Fix Controls (default and non-default) settings
    • NLS settings
    • Adaptive Cursor Sharing info
    • SQL Monitoring info
    • Partition Statistics history info
    • SQLs with the same Force Matching Signature

plus as usual bug fixes here and there.

Thanks to everybody who reported issues and provided feedback for new features! 🙂


Leave a comment

SQLd360 and ORA-7445 [evaopn3()]

A few kind people reported to me that SQLd360 disconnected in the middle of the execution. Looking into the details the cause was an ORA-7445 evaopn3() but such errors are a little tricky to track down because they only show up with a combination of faulty plan (that’s the bug) with specific data, that’s why the error never reproduced in my labs as well as at several other folks’ systems.

Galo Balda was kind and patience enough to report the error and test my suspects (Thanks Galo!!!) so we were able to identify a way to avoid the error.

The ORA-7445 was caused by bug 12672969 (I suggest you check the details in MOS, the bug is pretty “common”) and starting today SQLd360 works it around so that your execution shouldn’t disconnect anymore!

If you tried SQLd360 in the past but ignored it because of the unexpected disconnect then I suggest you give it one more shot now that the error should be taken care!


Leave a comment

Quick update on SQLd360 recent changes

The last blog post was about SQLd360 v1504 and last night I released v1507 so a couple released (v1505, v1506) were silent. This post is just a quick update of what’s changed in the last weeks.

  • ASH SQL reports have been removed, the API is very slow (was taking up to 90% of the overall SQLd360 elapsed time) and the report itself is usually not that useful compared to raw data.
  • ASH Raw Data report has been enhanced with several new columns (mostly wait events related), this section is useful for quick searches on the most common ASH columns
  • SQLd360 now leverages eAdam to export GV$ACTIVE_SESSION_HISTORY and DBA_HIST_ACTIVE_SESS_HISTORY for the SQL ID of interest, this is useful for detailed ASH mining operations
  • Two new reports have been included, number of execs by PHV and total elapsed time by PHV, they can help in understanding how impact each PHV is (ie. one single exec of the bad plan took as much as 20 execs for the good plan)
  • CBO environment and IO Calibration statistics are now collected

Plus a few minor improvements as well as several bug fixes 🙂

As usual please reach out of me if you have any question/comment/concern/suggestion!!


1 Comment

Trouble reading an execution plan? Maybe SQLd360 can help!

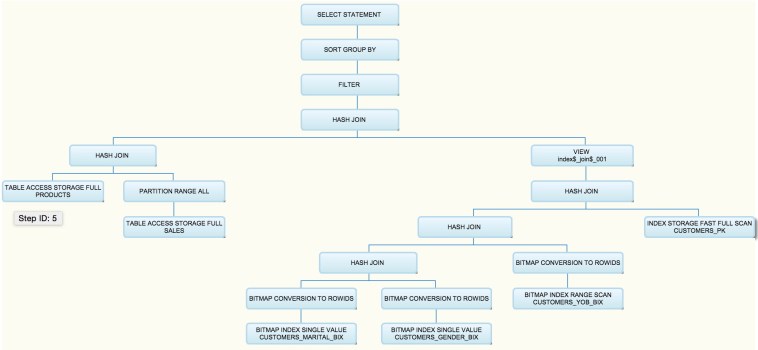
Last week I was in Dallas, TX for Hotsos 2015 and I had a few questions on how to read an execution plan so I thought why not including in SQLd360 an alternative representation of the execution plan, maybe one that is easier to understand and closer to the academic explanation of the execution plan as a tree.

The main improvements for version v1504 (released yesterday, March 8th) are around execution plans analysis, there is a new link “Plans analysis” in the Plans section with a few new reports, all organized by PHV.
Basically this new page will show N columns where N is the number of distinct plans for the SQL we focus on and for each PHV we have

  • Plan Tree
  • Average elapsed time per execution (recent and historical) from ASH
  • Top 15 wait events
  • Top 15 objects accessed
  • Top 15 execution plan step id / operation

The plan tree is an organizational chart where the execution plan is represented as a tree upside-down where the first operation executed is the first leaf on the extreme left and the next operation is the next left (walking from left to right) and where each couple (or more) nodes are combined together by their parent node.

Ie. in the following execution plan the first step is #5 but somebody might be tricked thinking it’s #13 (or #7) since more indentedScreen Shot 2015-03-09 at 10.21.40 PM

while looking at the new chart is way easier to understand that step #5 is indeed the first one executedplan

Hopefully you will like it too!!

Other small additions for v1504 are Optimizer system statistics, Segments/Objects information and fixes here and there that (hopefully) reduce the number of bugs in the code 🙂


5 Comments

SQLd360 v3 now available, new features and (hopefully) less bugs!

Couple of weeks ago SQLd360 v1 came out and now v3, so what happened to v2? It was a “silent” release to fix a bug and sneak in a couple features I didn’t complete in time for v1 but most of the new features are in v3.
The main page now looks something like thisScreen Shot 2015-02-26 at 10.01.13 PM

so the list of content grew a bit and it will keep growing release after release.
List of bugs (hopefully) shrank as well but no promise on that 🙂

The major additions are

  • Plan Control section reporting info about SQL Profiles, SQL Plan Baselines and SQL Patches
  • Execution plans details from SQL Plan Baselines
  • Time series report/chart for average and median elapsed for the SQL (regardless of the plan), this can help answer the question “how is my SQL doing over time?”
  • Time series report/chart for average elapsed time per plan hash value for the SQL, this can help identify if a change in performance is caused by a plan change
  • A standalone script to execute the SQL from SQL*Plus, the script includes bind variables definition/assignment in case the SQL has binds
  • Cursor Sharing section reporting info from GV$SQL_SHARED_CURSOR
  • Bind datatype mismatch report, this can help identify those cases where apps define binds for the same SQL using different datatypes

plus some other minor reports/tweaks.

Bug fixes here and there, specially in the histograms section where now every endpoint value is (AFAIK, if you see issues let me know so I can fix them!) properly converted and charted so we can leverage charts to analyze histograms 😀
Ie the following one is for SH.CUSTOMERS.CUST_YEAR_OF_BIRTHhistogram

From the chart above we can see how the data is distributed and for each bar(/bucket) the (approximate) value, how many rows belong to each bucket and the selectivity for an equality predicate for that specific value.

More things in the work and as usual feedback/comments/reported issues are very much welcome!!!!


73 Comments

SQLd360, SQL diagnostics collection made faster

Another tool to help with SQL Tuning? Yes! Hopefully with some advantage over what you used until today 🙂

Collecting diagnostics around a SQL is not fun, if you’ve been there you know that. It requires to extract info from several different places, the amount is high and it’s time-sensitive aka you should do it as quick as possible so that things around the SQL don’t change!

SQLd360 is a free tool that provides a 360-degree overview around a SQL statement. The output is a single zip file that allows offline analysis, trend analysis and detailed root-cause investigations. The content of the zip is a set of small reports, each specific to an area of interest, easy to navigate through an index file.

SQLd360 doesn’t require any installation and can be executed by any user that has access to dictionary views. The tool can be used by DBAs, Developers, SysAdmin, etc to investigate several aspects of the SQL, not only in terms of isolated execution but also in the context of the overall database impact, it can also help with trend analysis.
The list of contents is going to grow (fast) with time so make sure you use the latest version.

SQLd360 works successfully in 10g, 11g and 12c, specifically on Linux/Unix platforms, it has not been tested on Windows.

If what described so far sounds familiar then you are probably right. SQLd360 has been created to complement eDB360 tool created by Carlos Sierra. The design is similar but at the same time different having to deal with different challenges.
SQLd360 is also included in eDB360 starting version v1504.

Download

SQLd360 is free, you can download it from either GitHub or from the link under the Download section on the sidebar of this blog.

Instructions

Download SQLd360 and review the README.txt file included.
Unzip sqld360-master.zip on the database server and navigate to the master directory.
Connect to the database as any other user with access to dictionary views (SYS not recommended) and start sqld360.sql

SQLd360 has two input parameters

  1. SQL ID – SQL ID for which SQLd360 will collect diagnostics.
  2. License – SQLd360 extracts information from both AWR (licensed by Oracle under the Diagnostics Pack) and SQL Monitoring repository (part of the Oracle Tuning Pack). This parameter accepts one of 3 values: “T”, “D” or “N”. If your database is licensed under the Oracle Tuning Pack, enter then the value of “T”. If your database is not licensed to use the Oracle Tuning Pack but it is licensed to use the Oracle Diagnostics Pack, enter “D” then. If your site is not licensed on any of these two Oracle Packs, enter “N” then. Be aware that a value of “N” reduces substantially the content and value of the output. Thus the preferred parameter value is “T” (Oracle Tuning Pack).

Sample

# unzip sqld360-master.zip
# cd sqld360-master
# sqlplus / as sysdba
SQL> @sqld360.sql 0vy6pt4krb3gm T

SQLd360 usually completes within a few minutes but it can take longer in case the amount of data to analyze in AWR/ASH is significant. The output file can reach up to 100Mb so make sure the directory where the tool is executed from has enough free space.

Feedback
For any feedback please post on this blog or just email me directly.